
13 |EVALUATION DES MESURES PREVENTIVES DE CONTROLE DU COVID 19 A YAOUNDE II, REGION CENTRALE DU CAMEROUN
ASSESSMENT OF PREVENTIVE MEASURES TO CONTROL COVID 19 IN YAOUNDE II, CENTRAL REGION OF CAMEROON
Mots-clés:
COVID-19| pandémie| mesure barrière| Yaoudé II| Cameroun|Résumé
Apparu dans la ville de Wuhan en Chine en décembre 2019, l’épidémie de coronavirus a été déclarée comme pandémie le 11 Mars 2020 par l’Organisation Mondiale de la Santé. Cette nouvelle maladie s’est vite répandue dans tout le monde entier et le continent Africain a été aussi touché avec les pays comme l’Egypte, l’Afrique du Sud, le Nigeria…. Le Cameroun enregistre son premier cas le 6 Mars 2020. Depuis cette date, la propagation a semblé accélérer et la ville de Yaoundé a été la première ville du pays à enregistrer des cas. La présente étude a pour objectif général d’évaluer le niveau d’observance des mesures de lutte contre le Covid-19 par les citoyens de Yaoundé. Cette étude s’appuie sur l’exploitation des données secondaires de diverses sources. L’analyse des données a été effectuée par une méthode descriptive qui a permis de donner le rendu sous forme de tableaux et graphiques d’une part et par une analyse de contenu qui a permis de dégager des tendances d’autre part. L’exploitation des dites données permet de constater que la progression du coronavirus au Cameroun se fait de manière linéaire avec une moyenne de 74 nouveaux cas par jour entre le 30 Mars et le 15 Juin 2020. De plus, en date du 20 Mai 2020, la région du Centre, qui représente à elle seule, un cumul de cas de 1065, soit une proportion de 47,7% de l’ensemble des personnes infectées.
Introduction
Before 2019, the city of Wuhan was known for its industrial prowess; but since December of that year, the city has been making headlines and tabloids for the wrong reason. It is the ‘birth place’ of the COVID-19 pandemic. The first victim of the new virus (Severe Acute Respiratory Syndrome Coronavirus 2 or SARS-CoV-2), which was later named Coronavirus Disease-19 or COVID-19 was discovered in the city (Qiu et al., 2020). It spread rapidly throughout the world, resulting in human tragedy and enormous economic damage. The World Health Organization (WHO) officially declared COVID-19 a pandemic when the number of outbreaks expanded to more than 110 countries, with between 116,000 and 120,000 confirmed cases and more than 4,000 deaths. It is still believed to have the potential to reach exacerbated levels of transmission and economic crisis. The world is facing an unprecedented health crisis due to the Covid-19 pandemic. There have been more than 89 million cases of coronavirus worldwide and 1.9 million deaths (Mancia et al., 2020). Measures have been implemented worldwide, in both developed and developing countries, but with varying degrees of effectiveness. As part of social distancing, businesses, schools, community centers, and nongovernmental organizations (NGOs) have had to close, mass gatherings have been banned, and lockdown measures have been imposed in many countries, allowing travel only for essential needs (WHO, 2020). The goal is that through social distancing, countries can “flatten the curve” by reducing the number of new COVID-19 cases overnight to stop the exponential growth and thus reduce the pressure on medical services (John Hopkins University, 2020).
According to the International Monetary Fund’s first forecast (2020), the world economy will contract by about 3%in 2020. The contraction is expected to be of a much larger magnitude than the global financial crisis of 2008-2009. However, in its latest update (June 2020), the International Monetary Fund (2020) revised the forecast to a 4.9% contraction in 2020. The report cites the following reasons for the updated forecast: greater persistence of social distancing activity, lower activity during lockdowns, a steeper decline in productivity among firms that have opened, and greater uncertainty. The economic implications will be broad and uncertain, with varying effects on labor markets, production chains, financial markets, and the global economy (IMF, 2020). Many measures have been implemented in the developing world, although with variations in the degree of effectiveness. Nigeria is one of the countries that have been most affected by the pandemic. As of July 19, 2020, 214,228 COVID-19 tests have been conducted in Nigeria, of which 36,633 have tested positive. 37,225 COVID-19 cases have been confirmed (WHO, 2020). Of these, 789 official deaths have been recorded in 36 states and the Federal Capital Territory. 8,514 of the confirmed cases have occurred in the last two weeks with Lagos, Federal Capital Territory, Oyo, Edo, Delta, Kano, Rivers, and Ogun accounting for more than 64% of these cases (Orlik et al., 2020). Several measures were implemented in the country, with UNICEF scaling up technical assistance on risk communication, community engagement, and capacity building in 17 States (WHO, 2020). The new content focused on the safe provision of home-based care. In Lagos, community stakeholders and influencers were sensitized to the importance of preventative actions on COVID-19 to curb community spread, as mask-wearing and physical distancing rules are often not followed (WHO, 2020). Cameroon has not been excluded from the effects of the pandemic and many measures have been implemented to stop the spread of the pandemic. While the World Health Organization recently commended Cameroon’s management of the pandemic, the nonchalant attitude of Cameroonians during the festive season has been a major concern. Furthermore, as of November 20, 2020, the region most affected by COVID-19 is the Center (Yaoundé), accounting for 27.7% of all infected (MINSANTE, 2020). As of June 25, 2020, there have been more than 12,825 confirmed cases of COVID-19, with 7,774 recoveries and 331 deaths (MINSANTE, 2020). Cases have been reported in all ten regions of the country, but the majority remain in the Central and Littoral regions, where the crisis is accelerating. During the period of June 1-25, the number of cases almost doubled from 6,752 (MINSANTE, 2020). COVID-19 is one of the health challenges that have overshadowed the entire world, including Cameroon in 2020, and several measures have been implemented to control the spread of the pandemic. This was done by adopting a catalog of measures recommended by the World Health Organization (WHO). Several measures have been put in place to reduce the spread of COVID-19 in Cameroon (WHO, 2020). UNICEF’s partner, the Cameroon Red Cross (CRC), and a local start-up have installed 41 additional handwashing stations in public places in Douala, Kousseri, and Maroua. An estimated 365,000 people have benefited from functional handwashing stations installed in the city of Bertoua. In addition, the CRC volunteers sensitized approximately 231,000 people, including 69,700 men, 60,100 women, 56,100 girls, 45,300 boys, and 1,100 people with disabilities on the prevention, symptoms, and control of COVID-19 infections in Bertoua 1, Bertoua 2, Mandjou, Maroua 1, Maroua 2, Maroua 3, Kousseri, and Garoua-Boulai (MINSANTE, 2020). Although the government has called for strict adherence to the barrier measures, the degree of implementation of these measures is not yet known. With this in mind, this study was designed to assess the implementation of COVID-19 measures in the Yaoundé II subdivision where a good number of the population seems to be of the view that the pandemic does not exist and they seem not to take the precautionary measures of the prevention of the pandemic such as wearing of face masks and social distancing. Also, there appears to be poor enforcement of the implementation of the measures by the forces of law and order.
Méthodologie
1. Materials and methods
1.1. Location of the Study area
The study was conducted in the Yaoundé II subdivision (Map 1), in the heart of the political capital of Cameroon. It lies between latitudes3o 52.2’ and 3°55.2’N and longitudes 11o 28.2’ and 11°30.9’E. Yaoundé II subdivision is bordered to the north and the east by Yaoundé I subdivision, to the south by Yaoundé VI and Yaoundé III subdivision, and to the west by Yaoundé VII and Obala subdivision.
Map 1: Geographic location of the study area (Yaoundé II subdivision)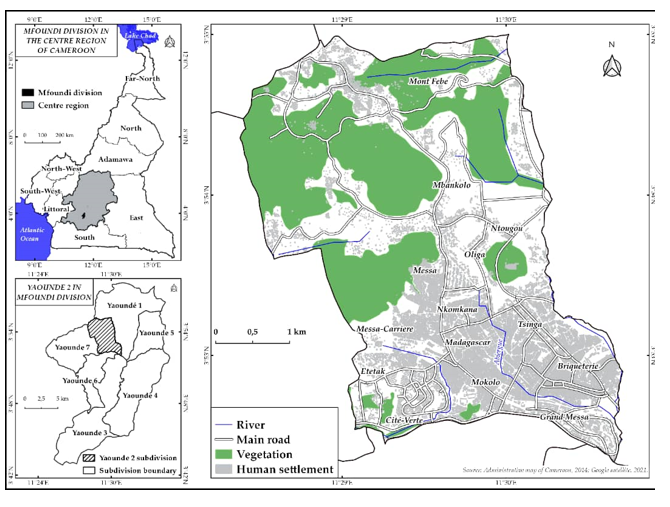
The climate of Yaoundé is tropical, though tempered by altitude, with a dry season from December to February and a rainy season from March to November. The rains decrease a bit in July and August, although the sky remains often cloudy. These climatic conditions favor the growth of the tropical forest. According to statistics provided by the Central Bureau of Census and demographic studies (BUCREP, 2005), the Yaoundé II subdivision had 238927 inhabitants, occupying an area of 15km2. The population is composed of natives and migrants from different regions of Cameroon seeking employment. The Yaoundé II subdivision is also home to expatriates from different parts of the world as most embassies are located there. The population is distributed in 18 districts of the subdivision. The most important ones are Tsinga, Briquererie, Mokolo, Messa, Cité Verte, Madagascar, Febe, Nkomkana, Carriere, Ntougou, and many others. In most cases, the settlement of the population in the neighborhoods was based on tribal, ethnic, or cultural affinity. The rural areas of Febe and Mbankolo are predominantly occupied by indigenous people. The neighborhoods of Carrier and Nkomkana are dominated by migrants from the western region; in the neighborhoods of Briqueteries and Ekoudou, there are mainly migrants from the northern part of Cameroon and Malians. All these populations live in a spirit of secularism and religious tolerance.
1.2. Data collection and management
The survey research design was employed in this study. It is a non-experimental design and the researcher collected information about the study variables by using questionnaires and interviews, which are survey instruments. The investigator also used descriptive analysis to show the links between the independent and dependent variables of the study.
The design of this study is a cross-sectional survey, conducted from August-September 2020 to March 2021. In this research, the target population is all people living in the Yaoundé II subdivision, and using the Lorentz formula, the sample size was estimated to be 336, 381 inhabitants. Based on the procedure, the sample size for the analysis was 390 individuals. Data collection for this research was from two main sources: primary and secondary data sources. Secondary data were collected mainly from reports on the management of the pandemic. These reports were obtained from hospitals, the Divisional Public Health Delegation, and the Yaoundé II council. Although this is the most recent addition to the catalog of biological hazards (biohazards) on planet Earth, scientific databases such as Google Scholar, Public Library of Science, and Directory of Open Access Journal are already flooded with scientific data on COVID-19. Articles were downloaded from these databases and searched to better understand the dynamics of the virus and, most importantly, to determine the dimensions on which most researchers based their study and to identify gaps in the literature. The information obtained from these sources significantly strengthens the theoretical roots of the study and has helped to refine the study and discussion of the results.
Primary data were obtained through field observations, questionnaires, and interviews. The purpose of the field observation was to assess the various measures adopted by the population to control Covid-19 in the Yaoundé II subdivision. Interviews were also conducted with health personnel and authorities. The administration of questionnaires allowed for the collection of reliable data for this research in other to assess the implementation of barrier measures against Covid-19 in the Yaoundé II subdivision. The collected data was entered into a spreadsheet by using the Statistical Package for Social Sciences (SPSS) version 2.0. Descriptive and space-related techniques were used in this analysis.
1.3. Ethical Approval
The protocol of this study was independently reviewed and approved by the University of Bamenda Ethics Committee. Informed consent was obtained from all participants included in the research. They were then invited to participate voluntarily in the analysis. They were informed that the study is confidential and that their participation will not affect their care.
Résultats
2. Result
2.1. Control strategies against covid-19 in the Yaoundé II subdivision
Barrier measures are planned procedures applied to regain control and prevent defined hazard situations. Figure 1 shows the extent to which the population of Yaoundé II complied with the barrier measures to stop the spread of the pandemic in the country.
Figure 1: compliance with barrier measures in Yaoundé II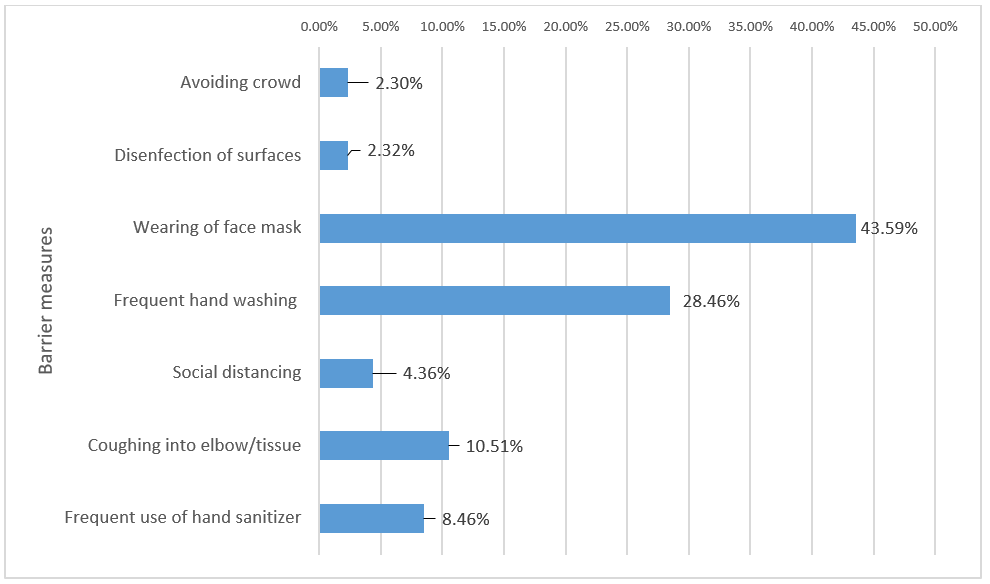
Source: Fieldwork, 2021
According to figure 1, the barrier measure most complied with by households in Yaoundé II is wearing a face mask (43.59%). It is closely followed by frequent hand washing (28.46%), coughing into elbow and handkerchief or tissues (10.51%), and frequent use of hand sanitizer (8.46%). Disinfection of surfaces and avoidance of crowds were perceived by the population as the measures least respected by households in Yaoundé II. Thus, wearing a face mask and frequent handwashing; together constitutes about 75% of the measures respected by the population of the area while the other measures share the remaining 25%. It is important to note that 42% and 33% of the remaining 25% represent compliance with coughing into the elbow/tissues and the use of hand sanitizer, respectively. The photos in plate 1 show the responsiveness of the population to the general call for compliance with barrier measures in Yaoundé II.
Planche 1: Responsiveness of the population to calls for regular handwashing at the Brickworks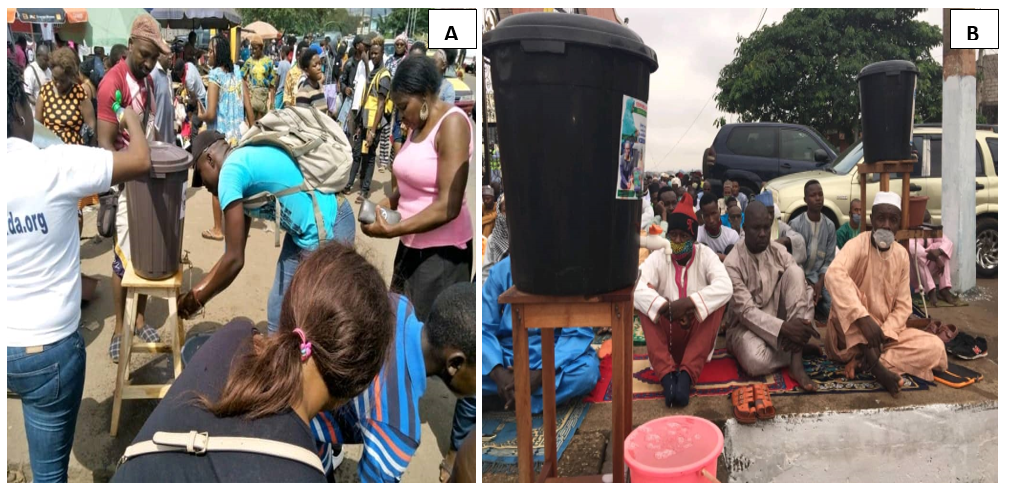
Source: Fieldwork, 2021
Although both photos generally show efforts by the population in the area to respect calls for regular handwashing with soap, other barrier measures are violated in the process. Further, both photos indicate that the prescribed social distance of at least 1 m apart is not being respected. This allows the disease to spread even through direct contact with infected persons. Another blatant measure violated in the pictures is the regular wearing of a face mask, especially in public places. In photo A, no one is wearing a face mask while in a public place. Even in photo B, where Muslims are seen far apart, not all are wearing face masks. It is very clear from these pictures that the attempt to respect one particular barrier measure is accompanied by the violation of other measures in Yaoundé II.
2.2. Barriers measures implemented by households against Covid-19 in the Yaoundé II subdivision
Yaoundé II has experienced many victims of the pandemic with some deaths recorded. Once infected with the virus, people are advised to isolate themselves, quarantine themselves or seek medical attention. Figure 2 displays summarized data from multiple response questions that asked households with a positive COVID-19 case in the jurisdiction to indicate any measures taken to avoid infecting other family members and to improve the victim’s health.
Figure 2: Perception of compliance with barrier measures in Yaoundé II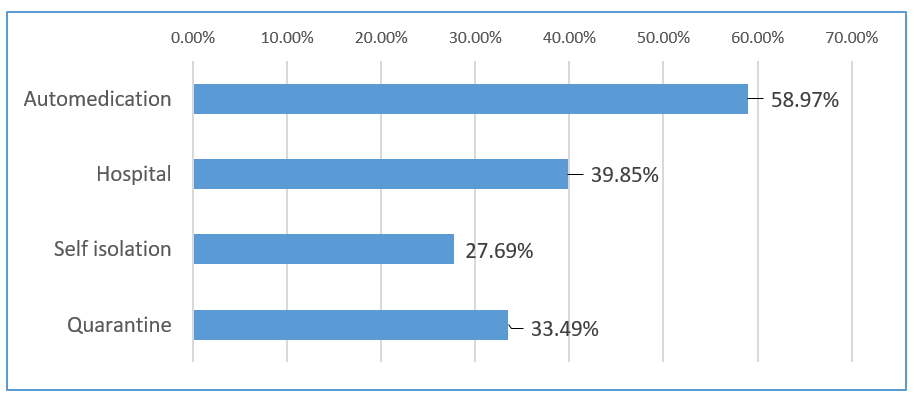 Source: Fieldwork, 2021
Figure 2 shows that more than half (58.97%) of the population of Yaoundé II, despite the risk and the rising infection rate of the virus, tried self-medication rather than rushing to hospitals when confronted with a suspected case of the virus. This is worrisome because poor management at the household level can be life-threatening for all household members. Although this is not encouraging, the silver lining is that 33.49% and 27.69% of families reported that suspected cases were quarantined or told to self-isolate respectively. Though these two measures can prevent rapid spread, they are not treatment but containment measures. Their implementation, especially quarantine, is therefore only possible with government intervention. In this regard quarantine centers were created within the health facilities in Yaoundé town Map 2).
Map 2: Yaoundé II health facilities in 2021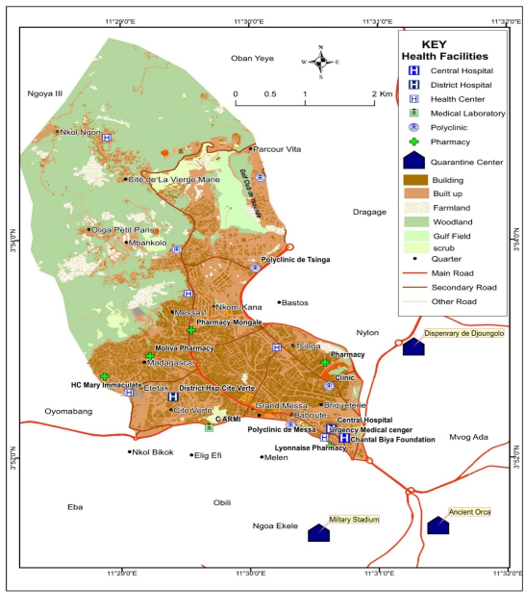
Source: Fieldwork, 2021
Map 2 illustrates the evolution of the number of quarantine centers in Yaoundé II and its surroundings. It also shows that the built-up area to the south and southeast had a higher concentration of health facilities than the northern part of the area. Although this could be interpreted as laxity on the part of the government to implement quarantine measures in the area, it can be argued that three quarantine centers were created very close to the jurisdiction (. These are the quarantine centers at the Yaoundé Military Stadium, The Ancient Orca, and the Djoungolo quarantine center.
2.3. Temporal trends in compliance with selected control measures between January 2020 and March 2021
This subsection of the study examines the temporal trends of Yaoundé II's population in compliance with disease control measures since the first case was recorded in the country in March 2020. These studies have revealed varying dynamics in compliance with selected COVID-19 measures respected in Yaoundé II.
2.3.1. Handwashing
The temporal evolution of household compliance between January 2020 and March 2021 is presented in figure 3.
Figure 3: Temporal trends in handwashing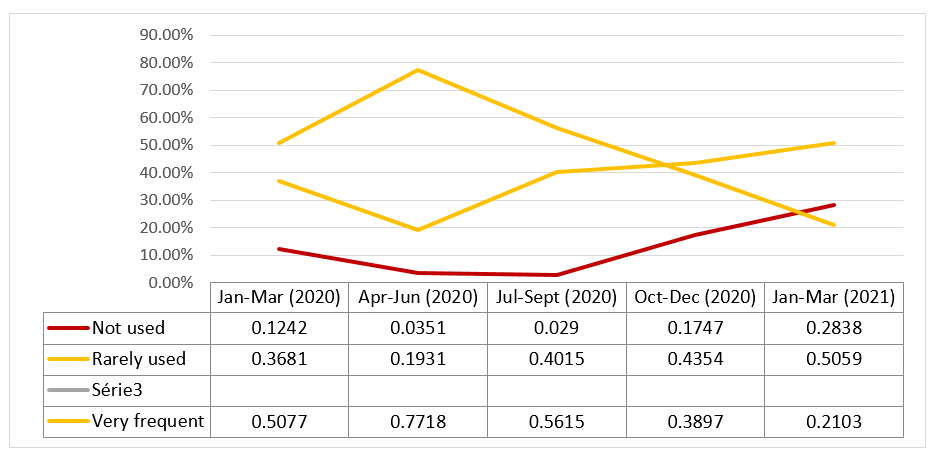
Source: Fieldwork, 2021
According to figure 4, the implementation of handwashing measures at the household level peaked during the first six months of the pandemic. Frequent hand washing was very common at the household level between January and December 2020. It increased from 50.77% between January and March 2020 to 77.18% between April and June 2020, then declined almost steadily to 38.97% (October-December 2020), and 21.03% in March 2021. Although the number of households that did not implement or rarely implemented the measure is relatively small, the number of households in this category has been increasing since July 2020. For example, households that did not use the measure increased from 2.90% (July-September 2020) to 17.47% (October-December 2020), and then to 28.38% (January-March 2021). Those who rarely use the measure went from 12.42% (January-March 2020) to 2.90% (July-September 2020) before steadily increasing to 28.38% (January-March 2021).
2.3.2. Trends in face mask use
Like handwashing, face masking also showed surprisingly strong dynamics in Yaoundé II during the aforementioned period. Figure 6 illustrates these dynamics.
Figure 4: Trends in face mask use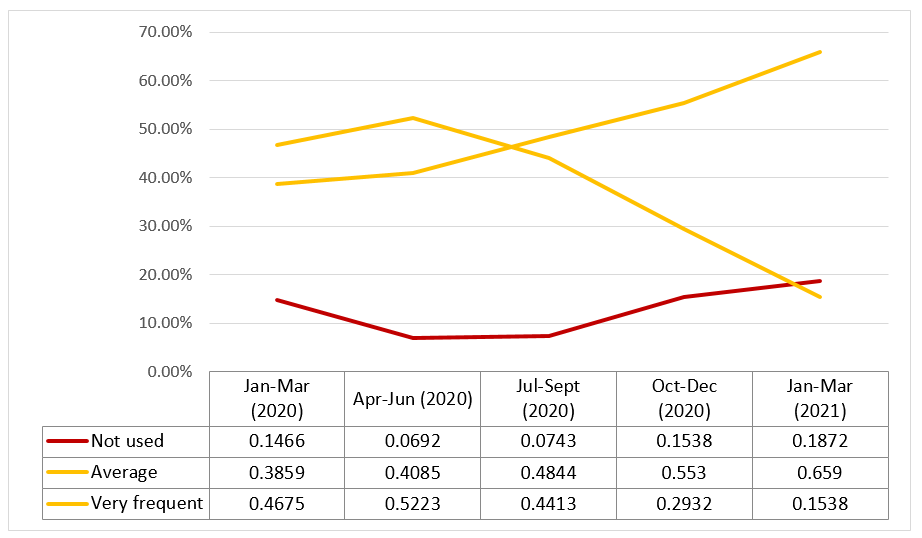
Source: Fieldwork, 2021
According to figure 6, frequent face mask use in Yaoundé II has shown varying trends. Between the first six months of 2020, the number of households frequently using the face mask increased from 46.75 to 52.23%. From this peak, the use of the measure by households in the study area began to decline. It dropped to 44.13% (July-September 2020), then to 29.32% (October-December 2020), and decreased again in the first three months of 2021. On the contrary, the scarcity rate of facemask use increased steadily over the period. From 38.59% between January and March 2020, it gradually increased to 55.30% between October and December 2020 and continued to increase this year. The number of households not using facemasks remained relatively constant over the period, though with a small increase of 4.06% during the aforementioned period. Thus, there is an overall increase in neglect of face mask use at the household level in Yaoundé II.
2.3.3. The tendency of Yaoundé II subdivision households to be screened
Figure 5 illustrates trends in household responsiveness to increased requests for testing in Yaoundé II.
Figure 5: Trends in household testing (screening)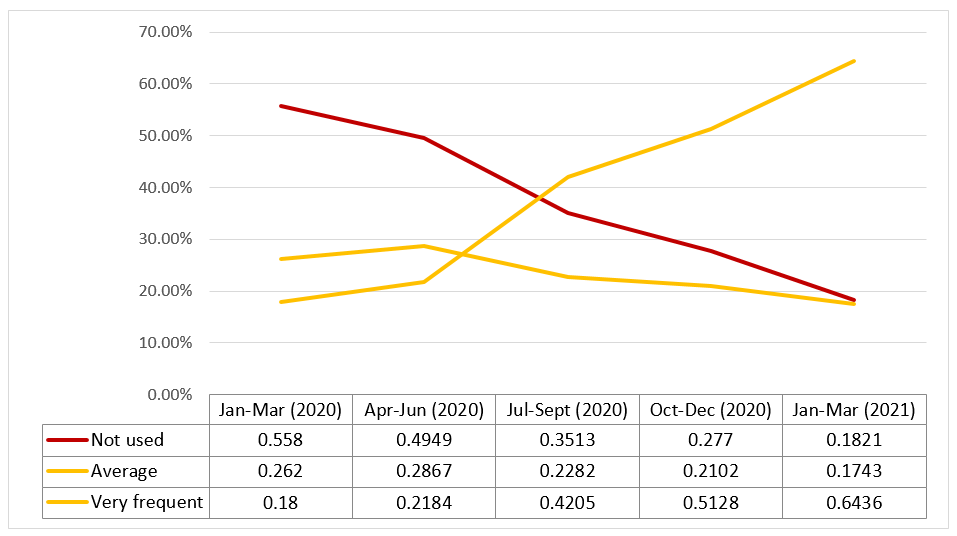
Source: Fieldwork, 2020
Figure 5 reveals that households are consistently responding to the growing call for screening. The testing rate was minimal at the beginning of 2020 and, despite the increasing call for screening; it slowly increased to 21.84% in the area in June. From that on, the rate of increase accelerated and nearly doubled to 42.05% in September, then to 64.36% in March of this year. The number of households that were completely unresponsive to testing calls decreased steadily in the area over the period. At the beginning of the year, more than half of the population of the municipality (55.80%) was not responsive to testing, but by the same time in 2021, that proportion had decreased by 37.59% to 18.21%. Although not very blatant, the number of households rarely responding to testing has steadily decreased.
2.3.4.Trends in social distancing compliance
One of the most difficult Covid-19 barrier measures to meet is social distancing. Their temporal trend in the study area is shown in figure 6.
Figure 6. Trends in social distancing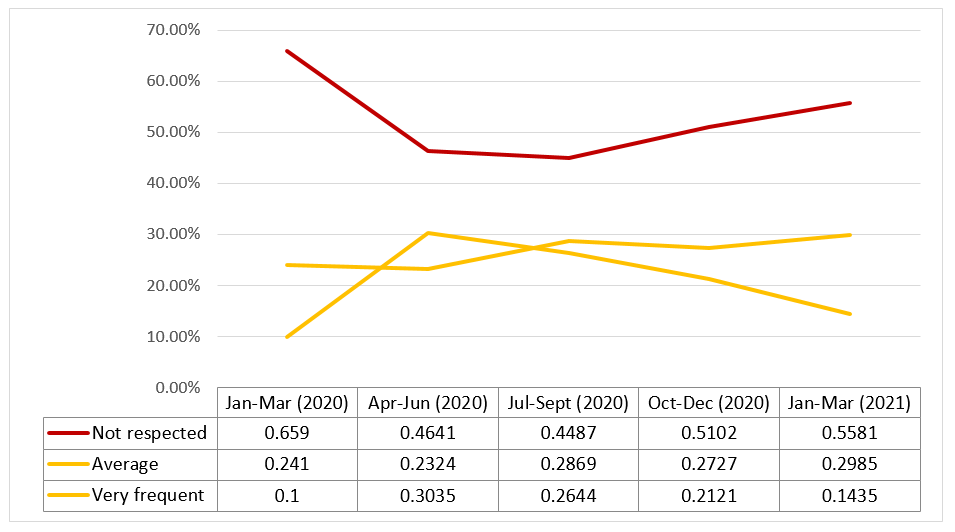
Source: Fieldwork, 2021
According to figure 6, compliance with social distancing measures at the household level was very timid. Its compliance increased in the first six months of the virus from 10 to 30.35%, but it decreased between that period and March 2021. The increase in its compliance in the first half of 2020 is therefore likely due to the very first lock-in measure implemented by the government in this period. Non-compliance is almost the direct antithesis of compliance. Households not complying with it fell from 65.9% in the first quarter of 2020 to 46.41 and 44.41% in the second and third quarter, respectively, and then rose steadily to 51.02 and 55.81% in the last quarter of the year and the first quarter of 2021, respectively. Throughout the period, households rarely meeting the measure remained fairly constant.
Conclusion
To reduce the spread of the virus, the government implemented a partial lockdown: businesses, schools, and community centers have been required to close down; mass gatherings have been prohibited whereby quarantine measures were imposed though with a variation in the degree of effectiveness in Cameroon. The goal of this study was to assess the implementation of COVID-19 measures in the Yaoundé II subdivision. Analysis of field data revealed that implementation of covid19 measures in Yaoundé II is mainly low. The most complied with covid-19 barriers measures in the Yaoundé II subdivision are face mask-wearing and frequent hand washing while the most complied with treatment measure is self-medication (which is unconventional). Therefore, the Yaoundé II city council needs to engage in a door-to-door sensitization campaign, not only to create awareness of the existence of the virus but also to guide people on how to effectively use measures such as face masks. This is crucial because face masks, as one key informant described, have become “reservoirs” and “vectors” of the virus due to their misuse. Police may be instructed or required to ensure that anyone moving through the streets of Yaoundé II wears a face mask. The government should also provide financial assistance to low-income households that are generally unable to effectively implement protective measures. This assistance could be provided in cash or kind.
Références
Bibliographical references
BUCREP,2005, Third general population and housing census, Central Bureau of the Census and Population Studies. www.bucrep.cm
IMF, 2020, Swift action helped fight the pandemic and limit the damage to people’s lives and the global economy. COVID-19 Annual Report. www.imf.org
JIANYIN QIU, BIN SHEN, MIN ZHAO, ZHEN WANG, BIN XIE, YIFENG XU, 2020, “A nationwide survey of psychological distress among Chinese people in the COVID-19 epidemic: Implications and policy recommendations”.General Psychiatry; [on line] 33:e100213. Doi:10.1136/gpsych-2020-100213.
JOHNS HOPKINS UNIVERSITY, 2020, coronavirus covid-19 global cases by the center for systems science and engineering. https://gisandata.maps.arcgis.com/apps/opsdashboard/ index.html/bda7594… accessed april 9, 2020.
MANCIA Giuseppe, REA Federico, LUDERGNANI Monica, APOLONE Giovanni, CORRAO Giovanni, 2020, “Renin-Angiotensin-Aldosterone system blockers and the risk of Covid-19.” N. Engl. J.Med Doi: 10.1056/NEJMoa2006923.[Epub ahead of print]-DOI-P?C-PubMed.
MINSANTE, 2020, Point de presse quotidien de monsieur le ministre de la sante publique, covid-19 du 23 Juin 2020, www.minsante.cm.
ORLIK Tom, RUSH Jamie, COUSIN Maeva, HONG Jinshan, Rush, J., Cousin, M., & Hong, 2020, “Coronavirus could cost the global economy $2-7 trillion. Here’s how”, https://www.bloomberg.com/graphics/2020-coronavirus-pandemic-global-economic-risk/.
QIU Jianyin, SHEN Bin, ZHAO Min, WANG Zhen, XIE Bin, Yifeng XU, 2020, “A nationwide survey of psychological distress among Chinese people in the COVID-19 epidemic: implications and policy recommendations”. General Psychiatry 2020;33:e100213. doi:10.1136/gpsych-2020-100213
WORLD HEALTH ORGANIZATION (WHO), 2020, world health organization dashboard, global statistics on covid-19 burden.www.who.int.
Downloads
Publié
30/06/2022
Comment citer
Revue Espace, Territoires, Sociétés et Santé ,[En ligne], 2022,, mis en ligne le 30/06/2022. Consulté le . URL: https://retssa-ci.com/index.php?page=detail&k=257
Numéro
Rubrique
Qui sommes-nous ?
Licence
Copyright (c) 2023 SOP SOP Maturin Désiré, ELOUNDOU Messi Paul Basile, KEMADJOU Mbakemi Deric Larey et ABOSSOLO Samuel Aimé

